 AIREITER
On August 17, 2026, OpenRouter disclosed that one of its own preview models had been quietly costing about $6.2K a month, roughly 25x its organization's blended rate, with 98% of that traced to a single batch-pipeline API key. The Activity dashboard launched the same day exists to surface that class of mistake in minutes instead of months. The UI half works well: spend, tokens, cache-hit rate, and per-request drill-downs in one place. The beta Analytics API underneath is rougher, and its edges are mapped below.
A $6.2K Lesson: What the OpenRouter Activity Dashboard Catches
The launch post's internal case study shows the exact failure mode the tooling targets. A preview model consumed $6,185 over 250M tokens in a month (about $24.7 per million tokens, 7.6% cache-hit rate), and drilling down by API key showed one key, batch-pipeline, holding $6,067 of it across 127M tokens and 37,000 requests: roughly $48/Mtok for high-volume, low-complexity batch work. The fix was a one-line model swap (full breakdown in the cost-control cookbook).
What shipped alongside the dashboard: an Explore view for custom queries, a Trends view for change detection, Guardrails for prompt-injection and sensitive-data events, request-level logs, the beta Analytics API, and an installable openrouter-analytics skill on GitHub for coding agents.
What Each Activity Tab Answers
The OpenRouter Activity dashboard is organized around questions rather than menus. Three tabs do most of the cost work, and each answers a different question.
Overview: what did we spend?
Overview opens with five headline metrics: total spend, request count, token volume, cache-hit rate, and blended cost per million tokens, each with a sparkline and a prior-period comparison. Below that sit top users and apps, spend by model, the split between OpenRouter credits and estimated BYOK spend, and prompt-versus-completion token counts. This is the tab you leave open when the number itself is the question.
Trends: what changed since last period?
Trends ranks changes rather than absolute sizes, across models, users, API keys, and apps. It's built for catching a runaway agent, a newly popular model, or an internal tool that suddenly went from experiment to default. Overview tells you something is expensive; Trends tells you it just became expensive.
Explore: how do I slice it myself?
Explore is the query builder. Metrics include spend, requests, several token categories, cache-hit rate, blended per-million cost, BYOK-versus-credit spend, plus P50/P90/P99 latency and throughput.
Grouping allows at most two dimensions at a time, chosen from model, provider, API key, app, user, workspace, country, region, context length, session, generation, custom IDs, and classifiers. Time rollups run from minute to month, charts render as bar, line, or dot plots, and any chart can be saved privately or organization-wide. Two caveats: a third grouping dimension is rejected outright, and prompt/completion content in logs only appears if private input/output logging was enabled before the request ran.
Export to CSV or PDF Without Touching the API
Accountants and spreadsheets don't need the API. The Activity page exports the same aggregated numbers as summary or detailed reports in two formats, with no code required. The official export flow is five steps:
- Open the Activity page.
- Pick a time period and a grouping (model, API key, or creator).
- Open the options menu in the upper-right corner.
- Select Export to….
- Choose CSV or PDF.
The default export is a summary covering spend, tokens, and requests together. For a detailed report, open a specific metric card first, then export: the detailed version breaks that metric down by your chosen grouping. Period choice fixes the sub-interval automatically:
| Time filter | Sub-interval |
|---|---|
| 1 Hour | per minute |
| 1 Day | per hour |
| 1 Month | per day |
| 1 Year | per month |
Two fine-print items from the docs: BYOK spend in these reports is an estimate at provider market rates, and it can diverge from your real external bill because provider-specific discounts aren't included. Reasoning tokens are billed inside completion tokens but reported separately, so the "thinking" portion of a bill is visible without being double-counted.
First Analytics API Query in Five Minutes
The Analytics API exposes the same data Explore computes, behind two endpoints. It is explicitly beta, so the workflow starts with discovery, not queries.
The management-key gate
Analytics endpoints require a management key; a regular inference key gets HTTP 403. The inverse also holds, per the cost-control cookbook: management keys cannot make model requests, which limits blast radius if one leaks, though it still exposes your organization's full spend breakdown. The cookbook's advice is blunt: treat the key like any other credential.
Meta first, query second
GET /api/v1/analytics/meta returns the metrics, dimensions, filter operators, and granularities currently supported. Query it before each automation run, because beta support changes. The actual query endpoint is POST /api/v1/analytics/query. The documented cURL example:
curl -X POST https://openrouter.ai/api/v1/analytics/query \
  -H "Authorization: Bearer <management-key>" \
  -H "Content-Type: application/json" \
  -d '{
    "metrics": ["request_count"],
    "dimensions": ["model"],
    "granularity": "day",
    "limit": 100,
    "time_range": {
      "start": "2026-08-01T00:00:00Z",
      "end": "2026-08-08T00:00:00Z"
    }
  }'
Responses nest rows under data.data with a metadata block (query_time_ms, row_count, truncated). The cookbook documents example queries at 17 ms for a single row, so these are cheap calls, and the workflow is described as read-only and free beyond your existing usage costs. Documented failure modes are 400 (bad query), 401 (no auth), 403 (wrong key type), 408, and 500.
Four Queries That Find Overspend
The official cookbook ships five recipes. Reframed as a sequence, they form a repeatable cost hunt.
1. Which model burns the most? The cookbook's opening query asks for total_usage, request_count, tokens_total, and cache_hit_rate grouped by model, ordered by spend:
{
  "metrics": ["total_usage", "request_count", "tokens_total", "cache_hit_rate"],
  "dimensions": ["model"],
  "order_by": { "metric": "total_usage", "direction": "desc" },
  "limit": 10,
  "time_range": { "start": "2026-07-01T00:00:00Z", "end": "2026-08-01T00:00:00Z" }
}
The key derived number is effective cost per million tokens: total_usage / tokens_total × 1e6. Compare it to your blended rate (the same formula with no dimensions) and the cookbook's heuristic applies: a model priced at a large multiple of blended rate is the strongest signal to chase. That's how the 25x preview-model anomaly surfaced.
2. Which API key is responsible? Add a filter on the exact model slug and group by api_key_id. Names resolve to human-readable labels in results, which is how batch-pipeline showed up holding $6,067 of the $6,185 problem. Group by api_key_id rather than filtering on resolved key names, and use the returned user_email to reconcile spend against internal records.
3. What did the money actually buy? Break the daily spend into components:
| Metric | Meaning |
|---|---|
usage_upstream | raw inference cost |
usage_cache | caching savings (or cache-write cost) |
usage_data | discounts, usually negative |
usage_web | web-search surcharge |
usage_file | file-processing surcharge |
A prompt-to-completion ratio around 20:1 flags oversized context, and a large reasoning-token share means you're paying for thinking you may not need. The best caching target is prompt-heavy traffic with a low cache-hit rate; if the cache rate is already high, look at model mix instead. Prompt-heaviness is the norm, not an anomaly: an analysis of OpenRouter's public programming-category data measured 93.4% of those tokens as input.
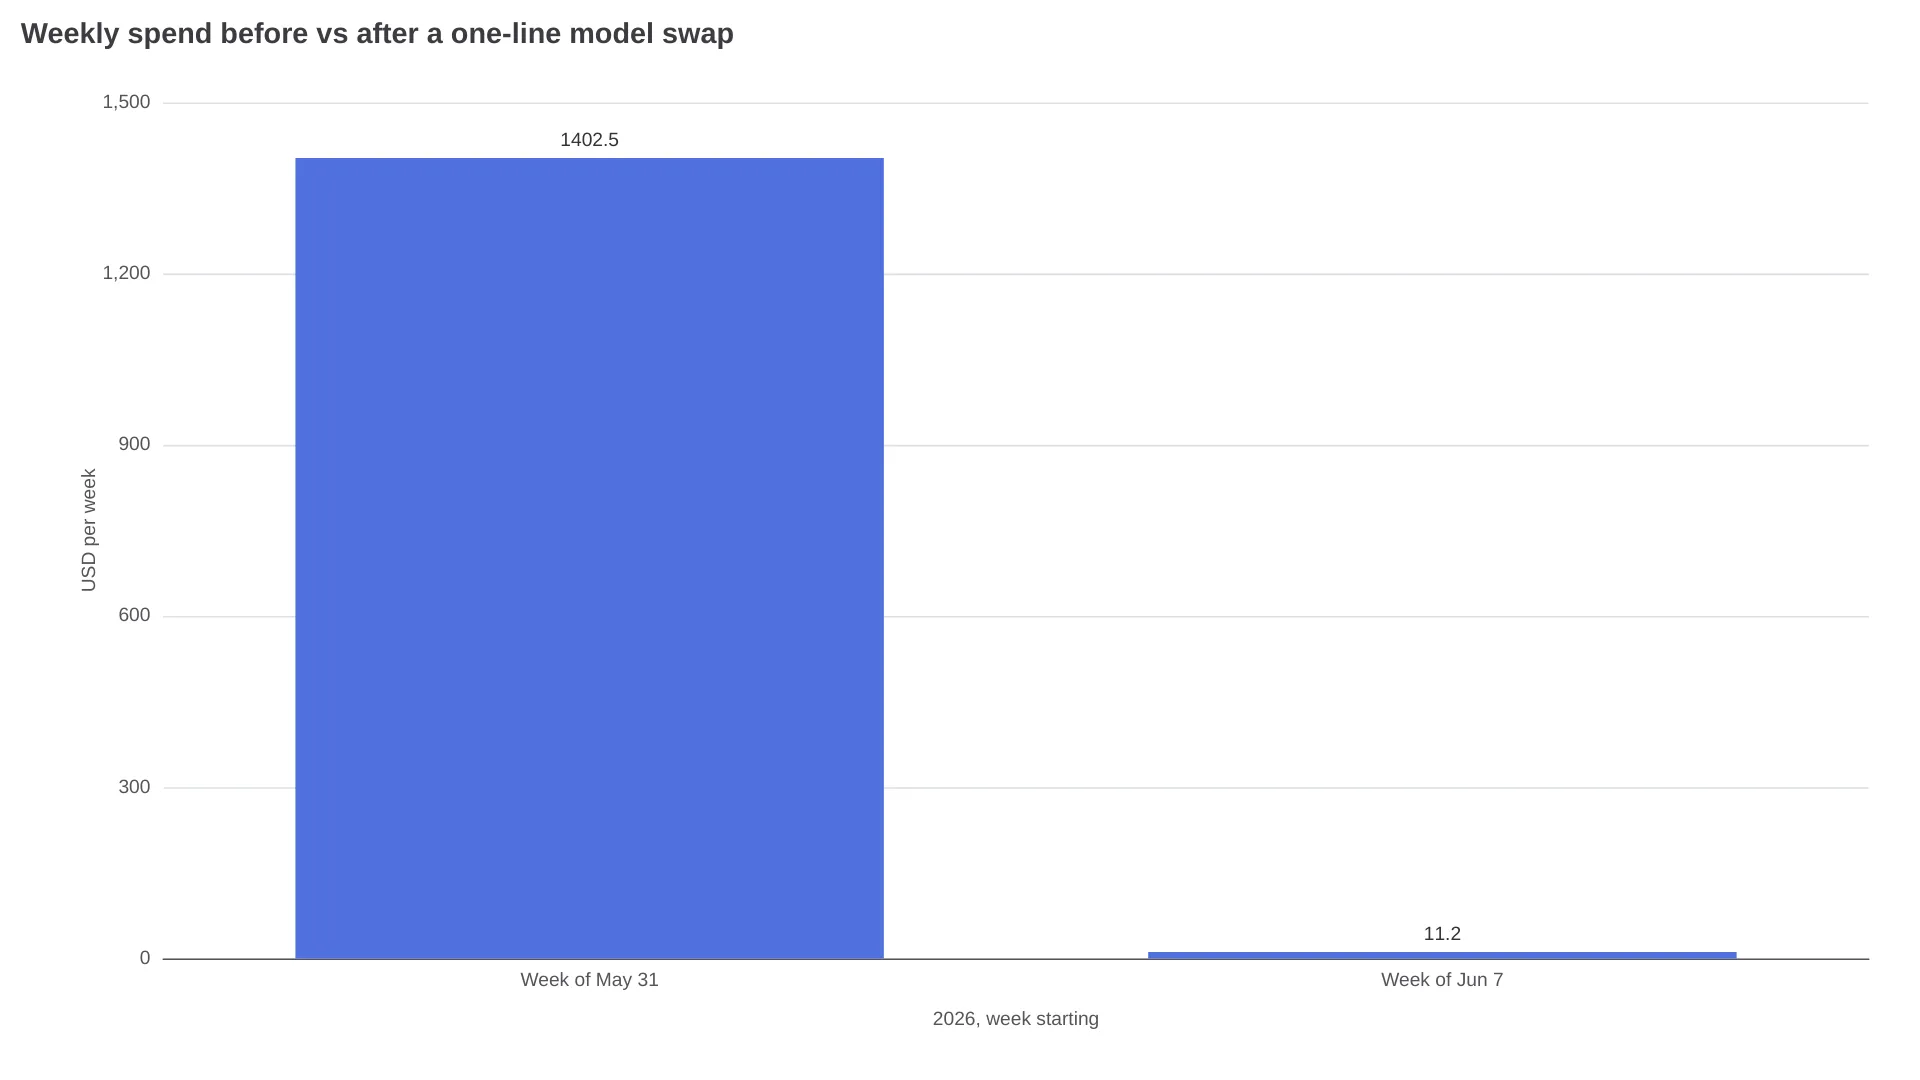
4. Did the fix actually work? Re-run query 1 as a weekly time series grouped by api_key_id. In the official example, the batch-pipeline key dropped from $1,402.50 for the week of May 31 to $11.20 for the week of June 7. A successful model repoint reads as a cliff, not a slope.
If the next step after query 1 is swapping to a cheaper model, OpenRouter's own routing layer is where that decision lands. The trade-offs between automatic and pinned routing are covered in our OpenRouter auto router guide.
Six Beta Sharp Edges the Reference Doesn't Spell Out
The API works as documented once your query is right; the failure modes below are documented too, just scattered across cookbook footnotes.
- Three dimensions return 400. The cap is two;
model × key × dayneeds multiple queries or a time granularity. group_limitcan silently truncate time buckets. Leave it unset and OpenRouter auto-computes a safe value; set it too low and weeks vanish from time series. It's ignored entirely when no dimensions are supplied.- Count metrics arrive as strings sometimes. The reference shows numbers; the API can return strings, so parse both.
- Time-series column names are ambiguous. The same bucket appears as
date__dayorcreated_at__daydepending on query shape. - Unused cost components return
null, not zero. A null-check belongs in any aggregation script. metadata.truncated: truemeans your totals are partial. Raiselimit(default 1,000) or narrow the time range and re-run.
Dashboard, API, or Your Own Pipeline?
Native tooling covers account-level questions. Self-hosting earns its keep only past that boundary:
| You need… | Use |
|---|---|
| Spend, tokens, cache rate at a glance | Activity Overview |
| What changed, what's spiking | Trends |
| One-off slicing and sharing | Explore + CSV/PDF export |
| Scheduled reports, alerts, internal dashboards | Analytics API |
| Multi-provider aggregation, per-user budgets, custom anomaly detection | A custom pipeline on usage logs and webhooks |
The self-host path is well-trodden. One r/FinOps poster:
"Built my own AI cost tracker in Obsidian because a model price jumped from cents to 3€ overnight."
That thread and the r/openrouter discussion "Long context pricing should be more transparent" share a root cause: local estimates drift from billed amounts because of routing, caching, reasoning tokens, and long-context pricing. The Activity dashboard's recorded usage is the authoritative number; if you self-host, reconcile against it rather than your own price table.
A lighter attribution trick from a builder with six months on the platform: tag requests with X-Title headers so each app or experiment lands under its own name in Activity. And if your spend is already spread across multiple providers rather than one router, a unified-API setup (AIReiter among them) collapses the aggregation problem before it starts.
FAQ
Do I need a management key for the Activity dashboard?
No. The dashboard is UI-only under your normal account login; the management key is required only for the Analytics API endpoints (/api/v1/analytics/meta and /api/v1/analytics/query).
Is the OpenRouter Analytics API free to call?
The cookbook describes the analytics workflow as read-only and free: you're querying your own usage records, not paying per call. You still pay for the inference the records describe.
How far back does OpenRouter activity data go?
The older /api/v1/activity endpoint covers the prior 30 completed UTC days. The new Analytics API's documentation doesn't state a retention limit (its example queries span a month), so treat long-horizon history as unverified and export CSVs for anything you need to keep.
Why can't I see prompts and responses in my Activity logs?
Prompt and completion detail only exists for requests where private input/output logging was enabled at request time — the announcement is explicit that historical prompt content is unavailable without it. Totals are recorded usage, content is opt-in.
The Trade-Off to Price In
Everything above is buildable today, and query 1 alone justifies the five-minute setup. The open risk is drift: this is a labeled beta whose supported metrics and dimensions can change, and OpenRouter itself instructs automation to re-read /meta before trusting a schema. Guard your cron jobs with a meta check instead of hardcoded field names, and the dashboard's visibility survives the API's adolescence.
Related reading: OpenRouter auto router guide · Best free OpenRouter models for programming · OpenRouter pricing guide